Quote:
Originally Posted by Jack91

Hey Russ, if possible could you do some graphs and fancy jazz that youve been doing, but for aus states? Maybe overlayed over the first wave?
If not, all good.
Also, in general, how can qld and nsw be getting such low cases? In my mind, by the time the infected person isolates (or not) its been spread to so many others. The 1 or 2 a day doesnt make sense to me.
Am I the only one thinking that metro vic restrictions make people unwilling to get tested, as the numbers will increase, and if they increase too much the restrictions wont ease?
|
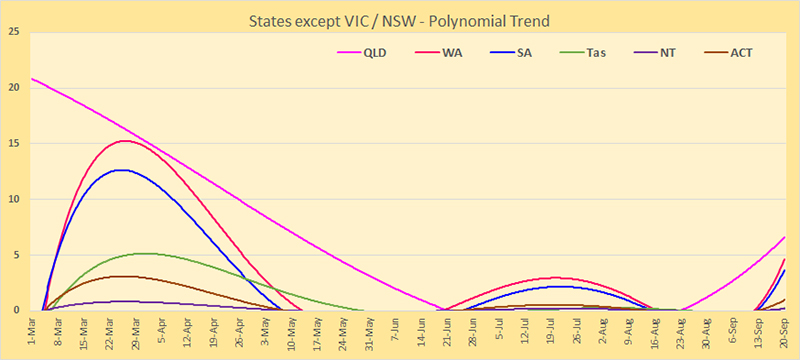
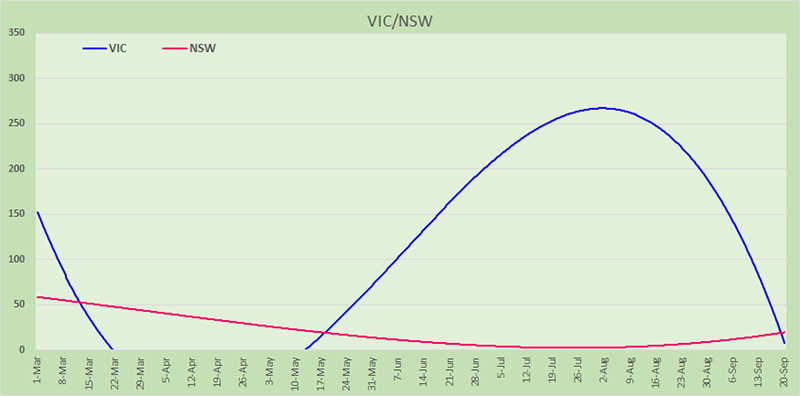
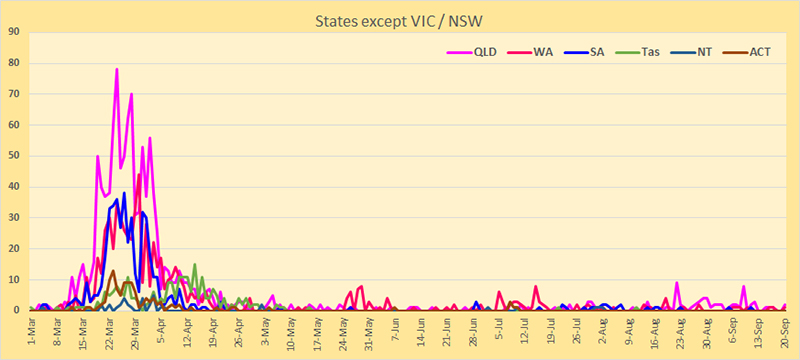
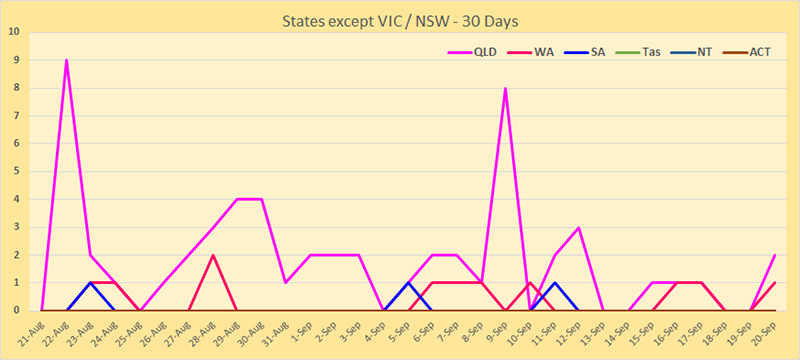
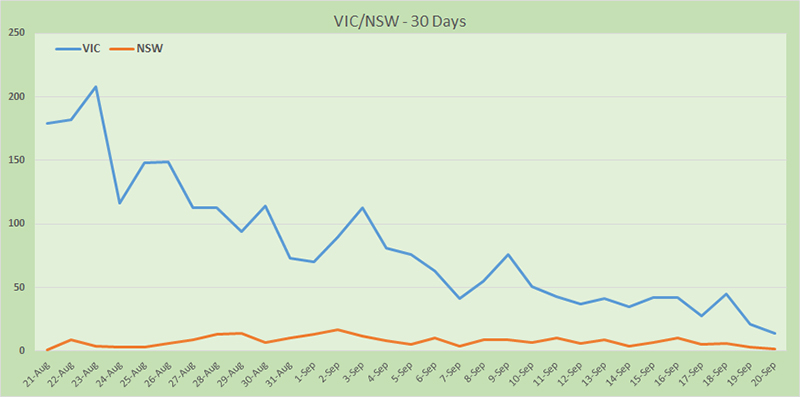
I've prepared two sets of data for the States - one since the pandemic began and one for the last 30 days. Because of the big difference in numbers between the States, the charts are divided into NSW/Vic and 'the rest'.
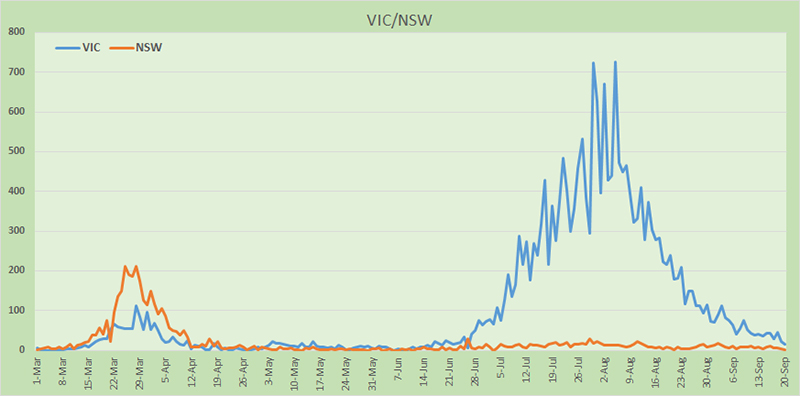
.. and the polynomial trends; 5th order for all except NSW/Vic which are 3rd order: